Gantt charts — the tool that nobody likes but everybody uses. As one of the many things that survived the end of the waterfall era, Gantt charts are often considered a necessary evil to give visibility on deliveries.
The product community tends to be critical of people that promote Gantt charts, but I think this is a little unfair. In the same way that good tools don’t make a good professional, a good professional can make use of “bad” tools to deliver a good job.
I want to deep dive into what Gantt is all about and how you can leverage it, regardless of how mature your company is in product management.
Table of contents
- What is a Gantt chart?
- Why the hate on Gantt charts?
- Are Gantt charts roadmaps?
- When to use a Gantt chart
- How to set up a Gantt chart for success
What is a Gantt chart?
Named after its creator, Henry Gantt, the Gantt chart’s first documented use for project management dates back to World War I, when the USA needed a tool to organize its army logistics. Since then, this chart has been used to manage anything, from erecting houses to organizing the first Five Year Plan inside the USSR.
In broad terms, the Gantt chart is a spreadsheet with date milestones on the x-axis and tasks on the y-axis. Those tasks occupy all the cells of their respective lines between the task’s start and end dates. When you plot everything out, you get something like this:
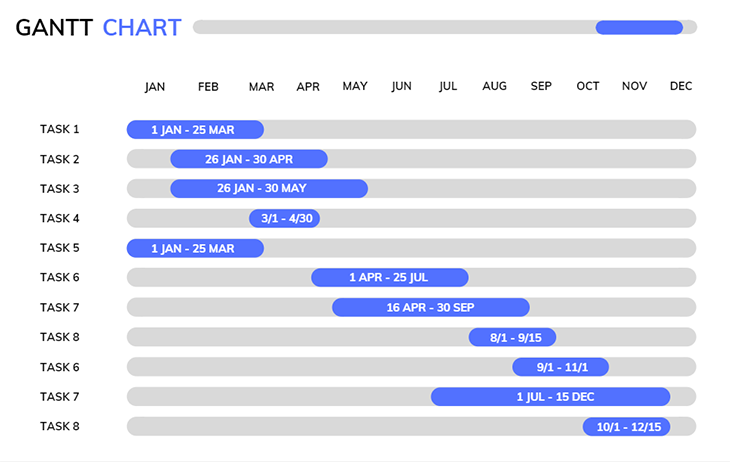
Nothing particularly bad about it, right? Why is it so ill-spoken about, then?
Why the hate on Gantt charts?
Gantt charts are not as detrimental to a modern product toolset as some make them seem. Just like any other management instrument, its effectiveness depends on its context and who’s using it.
Inside more traditional projects, some things just can’t be done outside of a critical path. You can’t start erecting a building by the penthouse, even though your architect said that’s the most valuable part. You need to start with the beams, then the floors, then the walls, and only then can you get to the penthouse.
Gantt charts are amazing at mapping critical paths.
Most of its bad name came from its adaptation to product development inside big tech companies, such as IBM or Intel, back in the day. Behind the alleged motivation of “giving visibility” and “keeping track of work,” early generations of tech project managers used the tool to back their lack of flexibility and inventiveness while committing to the infamous waterfall framework.
In the wake of the Agile manifesto, Gantt charts were so intimately connected with waterfall that you couldn’t separate one from the other. As waterfall withered and died, so did the popularity and usability of the Gantt chart inside tech companies.
But some things work so well that they can’t die…so they get a rebranding.
Are Gantt charts roadmaps?
Roadmaps, as a concept, are way bigger than a tool. “Opportunity solution tree,” “now, next, later” — those are some roadmap frameworks that can and should be used depending on the situation.
But being straightforward…yes they are!
It is unpopular to talk about Gantt charts, but every stakeholder ever wants to see timeline commitments. How do you do it? How to provide reassurance to customers and partners without the adequate tool?
Call Gantt charts roadmaps!
Just because things can be parallel now and we’re not so committed to dates as we used to be doesn’t make your roadmap any less of a Gantt chart. If you have a timeline on the x-axis and a list of work to be done on the y-axis, that’s a Gantt chart, period.
There is nothing wrong with that, though, as long as you keep in mind that Gantt charts and roadmaps are not the same things. The former is contained inside the latter, and you’ll have a very powerful tool at hand.
When to use a Gantt chart
Now that we’ve dismissed the hate mist that surrounds the topic, let’s try and apply it the right way. Before we start building a Gantt chart, we must assess if this is the right roadmap tool to be used. We can start with some simple questions:
Are my stakeholders powerful?
Who are your stakeholders? Are they enterprise clients, individual users, or other teams inside your company? Simply put, how much power does your stakeholder hold over you?
If a stakeholder holds little power, think of an individual user from an app with millions of daily active users — it’s easier to go around with loose dates. They don’t have much of an option other than to wait.
A powerful stakeholder, though, such as an investor or a key account, might turn their back on you if you don’t respect deadline commitments. Without this specific stakeholder, there is no product, so you better keep an eye on that delivery timeline.
How much work does it take to get something done?
How much value can you deliver with the least amount of effort? Are you ahead of a product team that manages to deliver value on each sprint or so, or are you committed to a juggernaut that takes at least a month to deploy the simplest of the features?
The popularization of the lean concept made most of us believe that if you don’t deliver at lightning speed, your product is wrong. This is not true.
Some products take more development time to present value. Think of a banking platform, a sales software, or a product that is being brought up from conception. All of those require a lot of tech effort before they can deliver anything considered useful.
Does a critical path exist?
Not all products have a linear value delivery process, but some have a high degree of interdependence, especially on their first iterations. Remember the penthouse example? A product with a lot of dependencies is exactly like a building: if you, let’s say, deliver the listing page before setting up the integration with your e-commerce inventory, you’re probably in for a lot of rework in the near future.
In the same way a penthouse without a building beneath it is just a house, the listing page without the inventory connection is just a screen. Without respecting a critical path, sometimes you do work that takes nowhere.
If you answered “yes” for at least two of those three questions, congratulations! Building a Gantt chart is the best way to present your roadmap.
How to set up a Gantt chart for success
Recapping, we use Gantt charts if our stakeholders are powerful, if it takes a lot of work (and therefore, time) to deliver each iteration, and/or if our product has a high level of interdependence between deliveries.
All too easy so far, but how do you avoid transforming your Gantt roadmap into a waterfall trap? Maybe more important than knowing when to use it is knowing how to use it. This is the one thing that separates you from going 40 years back in time to the PMBOK era.
Have a reliable team
Gantt charts are all about time commitment. They exist solely to predict and keep track of delivery. For them to work, though, you need a team that works like a clock. You must know beforehand how much time every person on your team takes on average to deliver their job: the PM yourself, the designer, the engineers, the QAs…
If you have an unreliable team, you’ll be setting yourself up for a nightmare. Deadlines won’t be respected, stakeholders will get mad, your team will get frustrated, and you’ll most likely botch value delivered just to make it fit on the time you have. This is exactly how products die.
If you don’t have an effective delivery framework in place, be it scrum, Kanban, or anything else, you can’t commit to hard dates.
Deal at the feature level, not the strategy level
Using Gantt charts as an interchangeable concept with roadmaps is dangerous, precisely because of the differences between those two spheres of work. You can time how long it will take to deliver a feature, but it’s almost impossible to time how long you’ll commit to a strategy until it delivers value.
It’s common to see roadmaps for quarters or semesters, using Gantt to define when and for how long a team will dedicate itself to solving some challenges. What happens if time runs out and you’re not there yet? Do you just drop the plan? But isn’t the challenge still worth pursuing?
Plotting down too broad Jobs-to-be-Dones in a Gantt chart generates similar results as committing to dates with an unreliable team: stress, low morale, and bad value delivery.
Don’t make it too long
Gantt charts have little to no space to change commitments around. Part of the tool’s bad PR comes exactly from its lack of flexibility in an ever-changing modern tech environment.
Knowing this limitation (nothing is perfect), it’s fundamental that you don’t overcommit. Make a Gantt chart for the quarter, at most. Building one for the whole year or even more is a guaranteed way to be forced to throw it away in a short time.
Don’t take it so seriously
Back in the day, the team served the Gantt chart, not the other way around. If something was two weeks late, the project would be considered critically endangered.
When we shifted our attention from work getting done to value being delivered, we broke our shackles from time commitment. It doesn’t matter if you deliver garbage on the agreed date, it’s better to deliver something useful even if it is somewhat late.
Overcommitment is bad for product culture. It’s impossible to hit the nail on the head every time, even if you have a reliable team and a well-mapped feature roadmap. Managing stakeholders on the possible brittleness of those hard dates is fundamental to having a healthy relationship with your Gantt roadmap
Conclusion
Be you a product manager or project manager, it doesn’t matter how much prejudice surrounds a tool. If you understand how to use it and when to use it, you’ll get awesome results.
This is not a tutorial by any means, it’s more of a redemption letter for one of the most undervalued roadmap tools out there.
It doesn’t matter if you’re using Jira, Excel, Canva, or Miro. As long as you have the basics of how, for whom, and when in the back of your head, you can build your Gantt charts without fear of hurting any product’s holy law.
Featured image source: IconScout
The post Gantt charts: A step-by-step guide for modern teams appeared first on LogRocket Blog.
from LogRocket Blog https://ift.tt/8mzJs6T
Gain $200 in a week
via Read more