When we have an idea for a phone app, or a customer asks us to make an app to fulfill a certain need, our first step is usually to set about planning how we would approach that particular problem. Then, once we have completed thinking about how we should design the application, we start to rough out an implementation for the app in question.
Over time, we add features, and the complexity of the application grows. It’s often not too long before we hit a bug within our app. Some bugs are obvious and don’t take much effort to locate, whereas other bugs can be rarer in occurrence and can almost be daunting to locate and fix.
Fortunately, on Android, we can use the Android Debug Bridge (ADB) to perform advanced troubleshooting on our device. As long as we have any Android phone, we can make use of ADB.
In this article, we will cover:
- Benefits of using the Android Debug Bridge
- Setting up the Android Debug Bridge for use
- Adding the
platform-toolsdirectory to our path - Opening up the Android emulator
- Using the Android Debug Bridge
- Putting all our Android Debug Bridge knowledge together
Benefits of using the Android Debug Bridge
The Android Debug Bridge lets us:
- Send and receive files from our Android device
- Listen to advanced debugging log messages through
logcat - Install specific APKs
- Uninstall packages by their package name
- Use an interactive shell on our device
This all sounds pretty great, right? Let’s see all of this in action now.
Setting up the Android Debug Bridge for use
Because the Android Debug Bridge is a developer tool, it comes as part of the Android Platform Tools. Depending on whether you run Windows, Linux, or macOS, you can find the right installer that you need for your system:
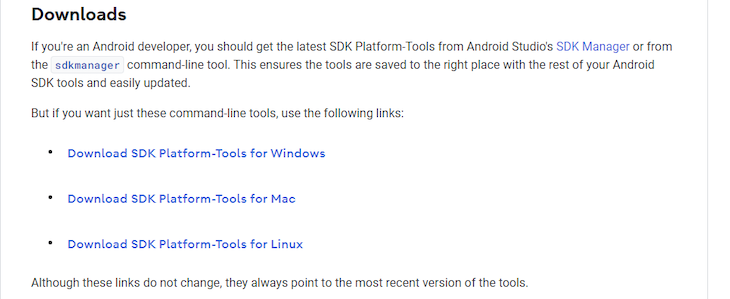
In our case, we’ll retrieve the platform tools for Windows. Once you’ve downloaded them, extract them to somewhere like c:\tools\platform-tools where you can have easy access to them.
In the extracted folder, we’ll have our adb.exe file.
Adding the platform-tools directory to our path
Normally, when you use the Android Debug Bridge tool, you’ll be in the directory of the app you’re developing.
It quickly gets old having to navigate to this folder in order to use ADB, so to streamline this, let’s go ahead and add it to our path. That way, we’ll be able to call ADB no matter what directory we’re in.
To do that, add the platform-tools directory to your systems path. The instructions for doing so differ depending on what version of Windows you’re on. Afterward, open up a command prompt, type adb, and press enter.
If everything goes to plan, you should get quite a bit of console output as ADB tells you about everything it can do.
Opening up the Android emulator
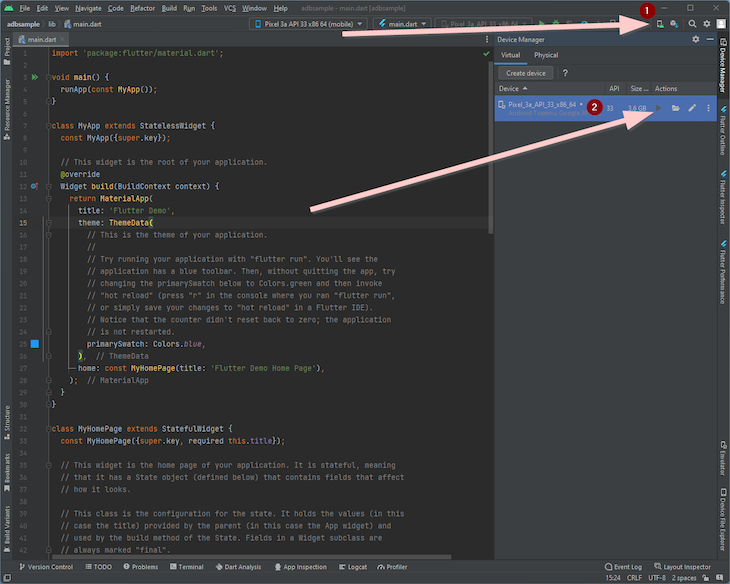
To give us a device to work with, let’s go ahead and open up the Android emulator. To do that, open Android Studio, click “Device Manager,” and then start the emulator in the list:
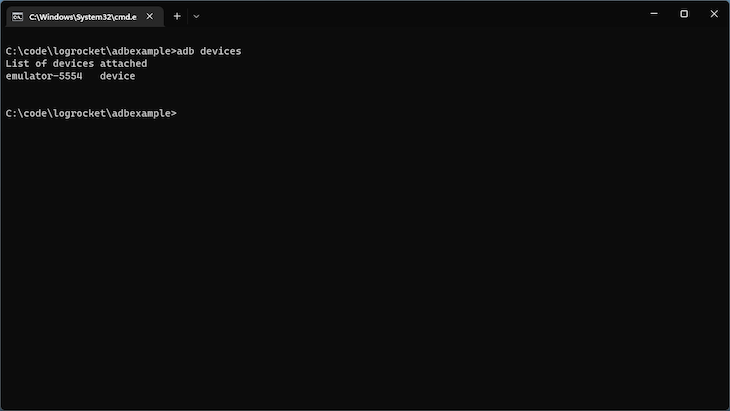
Once the emulator has started, type adb devices to see a list of connected devices. As expected, we can see there is one connected device — the emulator:
Using the Android Debug Bridge
ADB is a Swiss Army Knife of options when it comes to what it can help you with on an Android device. Let’s run through a few practical examples of what it can do.
Acquiring an interactive shell terminal
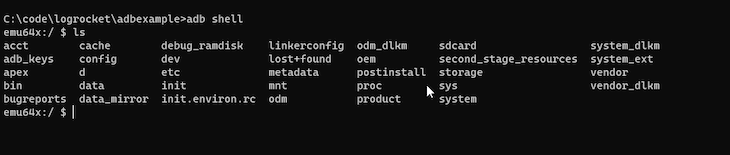
Once we know that we have a connected device, type adb shell and press enter. This will give us an interactive terminal that we can use to browse the emulator image.
Because Android phones are based on Linux, most standard Linux terminal commands will work here, like ls to get a directory listing:
There’s not a lot we can do with this right now, but it is something we will circle back to later.
Copying a file from the local computer to the device
If we have a file on our local device, and we would like to copy it to our connected Android device, that’s something the Android Debug Bridge can help us with. For this example, we’ll use a test APK from GitHub.
Go ahead and download the APK now. Once completed, you should have Hello World.apk in your “Downloads” directory.
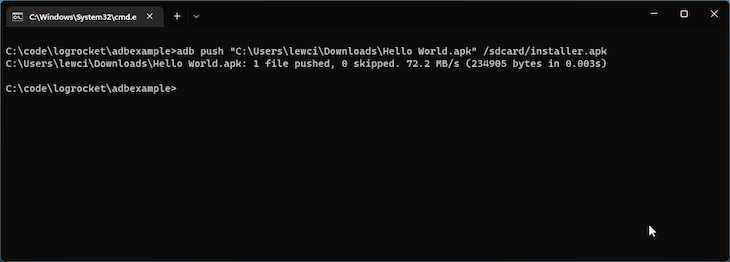
To copy this file to our device, we can use the following command:
adb push "Hello World.apk" /sdcard/helloworld.apk
After running this command, you should see the below:
On the emulator, we can see that this file has been copied to the local phone storage, which we can see in the “Files” app:
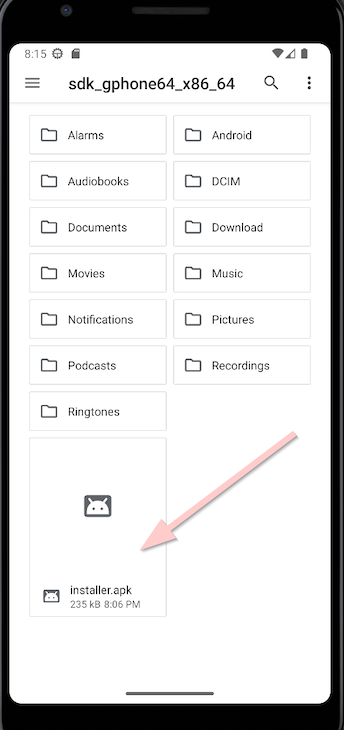
If you’re new to Android or new to ADB, you might think it’s strange that we’re writing to the sdcard directory. That’s just internal storage on the phone itself, a holdover from the days when phones came with built-in SD card readers.
Copying a file from the device to our local machine
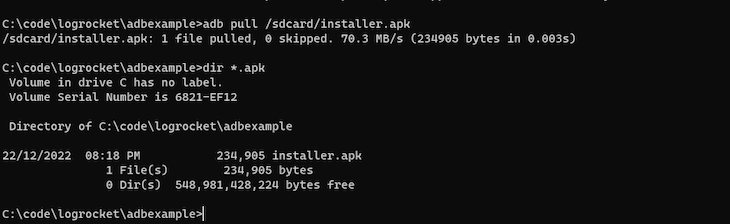
We can run the above operation in reverse and copy a file from the device back to our local computer. This is as simple as calling adb pull /sdcard/installer.apk. The file will be retrieved and have the same name on our local computer as it does on the device:
Installing an APK over Android Debug Bridge
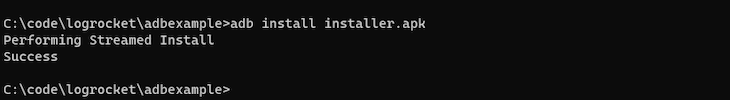
If we have an APK that we would like to install on the device, and we don’t want to bother with copying it to the device to install it, we can install it directly using ADB. To do so, simply type adb install installer.apk and you should see the following:
Afterward, the app will appear on our device.
Removing an app by package name
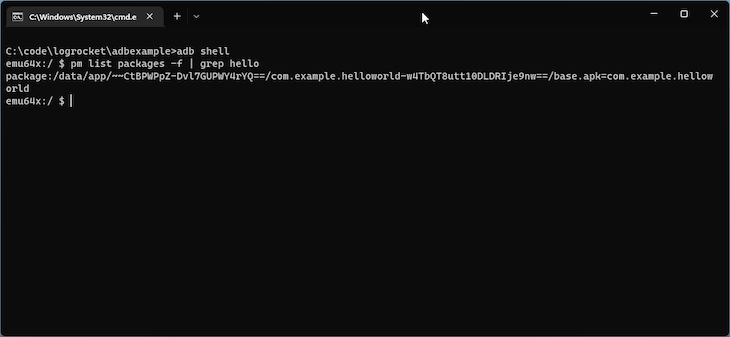
Now, let’s remove that Hello World app we just installed. We can retrieve a list of installed packages by first typing adb shell, and then using pm list packages -f to get a list of all installed packages. However, if we do that, we will see a lot of installed packages.
Because we have a functional shell, we can use tools like grep to easily filter on the results. In this case, typing pm list packages -f | grep hello will give us an exact list of packages that have the word “hello” in them.
As we can see, that list is quite short, only containing the package we installed:
Now that we know the package name is com.example.helloworld, we can use exit to leave the interactive shell, and then type adb uninstall com.example.helloworld to remove this app from the phone:
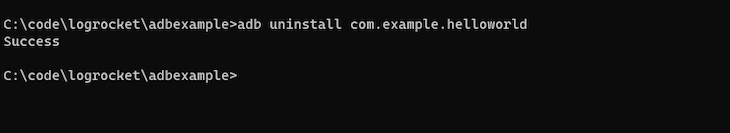
And just like that, the app will be removed from the phone.
Viewing advanced logging information from the device
If we type adb logcat at our terminal and hit enter, we’ll see a live view of the logs that the device is creating over time:
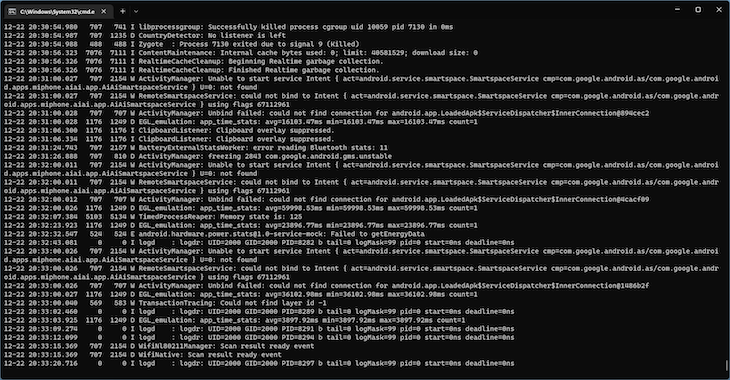
These logs are very chatty. It’s not easy to diagnose the issue you are after when you have to scroll through so many messages. Fortunately, there are a couple of things you can do to mitigate this.
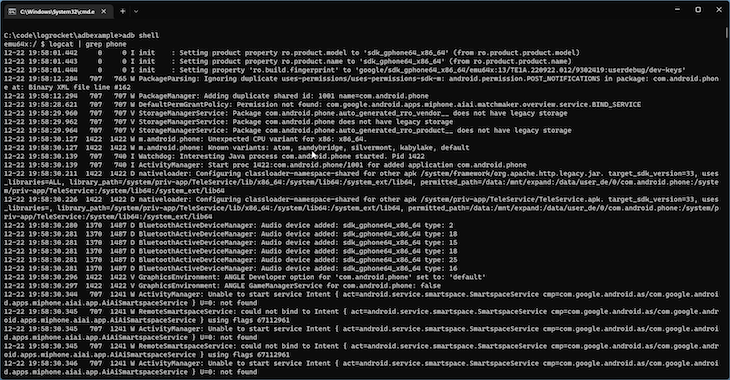
Your first option is to use logcat in combination with grep over adb shell. First, use adb shell to access the phone. Then, use logcat | grep searchterm to only see log messages that have your keyword in it.
In my case, typing logcat | grep phone only returns log messages that have the phrase “phone” in them:
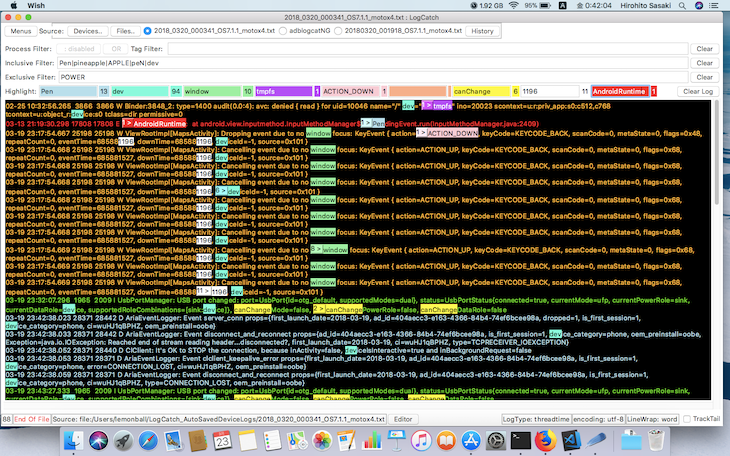
Your second option is to use a prettier logcat viewer. There are a few options in this space, but apps like LogCatch let you view logcat logs in an easier-to-understand manner, with powerful filtering tools.
Take a look at this screenshot from the LogCatch repo to see an example:
Putting all our Android Debug Bridge knowledge together
Something that you may need to do when you are working on your apps is pushing specific files to your app to place it in a certain state.
For example, let’s say you are releasing an app that uses a SQLite database and you are planning on adding or removing columns or schema data from a user’s device.
You would want to be able to push a specific database to the device and then launch the app to see if the app can handle the migration without encountering problems:
After our app launches, we can get it to produce a path saying where the SQLite database has been created. In my case, it’s located at the following path:
/data/user/0/com.example.adbsample/databases/testappdatabase.db
We want to pull the database in, modify it, and then push it back to the emulator.
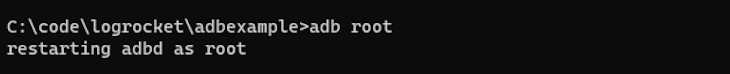
Due to the security constraints on Android, we’ll have to run adb root to tell the Android Debug Bridge that we want to run as the root user. This will let us access and modify otherwise protected parts of the Android system:
Now, we should be able to pull in our database by simply executing the following command:
adb pull /data/user/0/com.example.adbsample/databases/testappdatabase.db
The result:
C:\code\logrocket\adbexample>adb pull /data/user/0/com.example.adbsample/databases/testappdatabase.db
/data/user/0/com.example.adbsample/databases/testappdatabase.db: 1 file pulled, 0 skipped. 5.3 MB/s (16384 bytes in 0.003s)
Next, we can use any available SQLite browser to open this database and see the contained data:
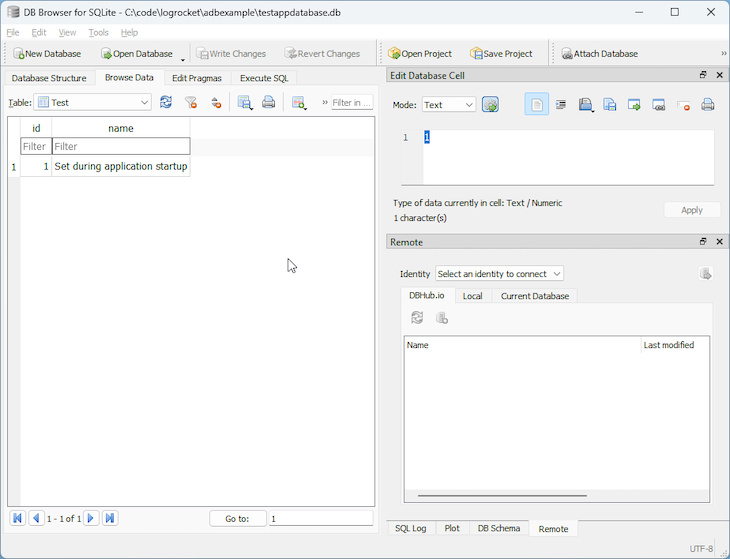
For our test, we can change “Set during application startup” to “Modified on the local computer” and save the database. Next, we can push that database back to the device by using the following command:
adb push testappdatabase.db /data/user/0/com.example.adbsample/databases/testappdatabase.db
The result:
C:\code\logrocket\adbexample>adb push testappdatabase.db /data/user/0/com.example.adbsample/databases/testappdatabase.db
testappdatabase.db: 1 file pushed, 0 skipped. 3.6 MB/s (16384 bytes in 0.004s)
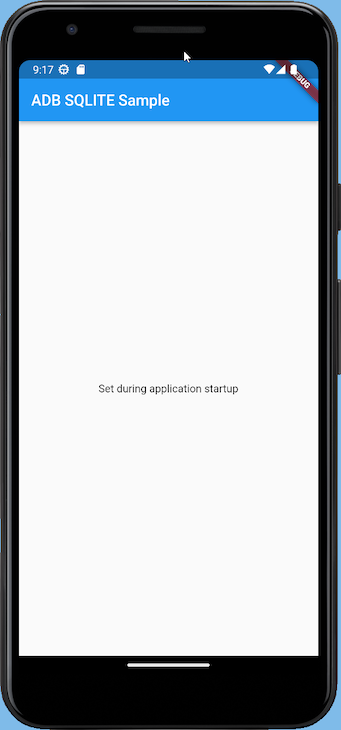
And if we rerun the app, we can see the value has updated with what we have set locally  :
:
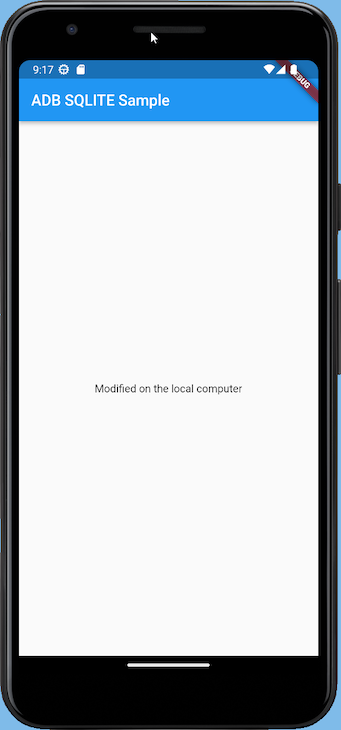
Our Android app now reads from the file that we have just pushed in via the Android Debug Bridge. This example is contrived, but you can use this when you are testing out database migrations, or just want to inspect files that your app uses internally.
Conclusion
Learning how to use the Android Debug Bridge is a requirement for any serious Android developer. The power and features it brings to the table are well worth the effort.
To become even better in the interactive shell that you get when using adb shell, you can refer to a list of commonly used commands at the Linux terminal.
If you want to brush up on other Android development skills, read about incorporating machine learning or making your app faster and more secure with code shrinking.
The post How to use Android Debug Bridge for advanced troubleshooting appeared first on LogRocket Blog.
from LogRocket Blog https://ift.tt/oebKPND
Gain $200 in a week
via Read more