In this guide, we’ll describe what a perceptual map is, explain how it differs from a positioning map, and review the various types of perceptual maps. We’ll also walk through steps to build your own map and provide a perceptual map template to help you get started.
Table of contents
- What is a perceptual map?
- Perceptual map vs. positioning map
- Types of perceptual maps
- Why use a perceptual map?
- How do product managers use perceptual maps?
- How to build a perceptual map
- Perceptual map template
What is a perceptual map?
 According to the dictionary entry that appears when you google the term, perceptual means “relating to the ability to interpret or become aware of something through the senses.” A perceptual map is a visual aid that shows how consumers perceive a product compared to its competitors in the market. In other words, it lays out consumers’ perception of various brands in a product category.
A perceptual map is a diagram that illustrates the position of a product along with its competitors on certain parameters.
Perceptual maps not only help you identify the current position of a product, they also help you understand where it needs to be in future. Market researchers and businesses analyze perceptual maps to identify competitive advantages and weaknesses and to chart paths to pursue new opportunities.
Perceptual map vs. positioning map
A perceptual map and a positioning map are not the same thing. Perceptual maps indicate how customers perceive the various products in a given category while a positioning map evaluates actual features of brands.
Put another way: A perceptual map represents the perception of a customer, which might be right or wrong, whereas a positioning map represents reality.
At a first glance, these maps might look similar, but they analyze different parameters and represent different data.
Types of perceptual maps
There are two major types of perceptual maps:
Two-dimensional
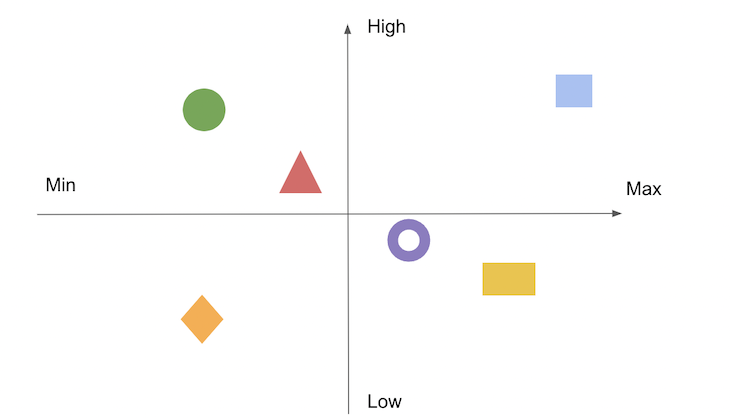
A two-dimensional perceptual map is the standard type that is used most often in product management and marketing because it is easy to understand and analyze.
Below is an example of a two-dimensional perceptual map:
Multidimensional
A multidimensional perceptual map has more than two dimensions for parameters and the brands are plotted against multiple parameters. These maps are complex to plot and can be difficult to understand. The benefit of using a multidimensional map is that it can provide in-depth information regarding the perception of a product with respect to multiple parameters.
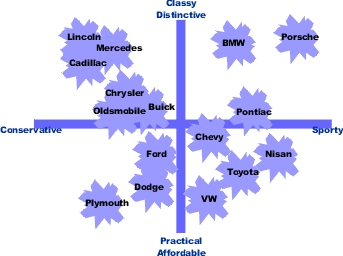
Below is an example of a multidimensional perceptual map:
The example above is a multidimensional perceptual map for pain medications plotted against multiple parameters, including gentleness, effectiveness, duration of effectiveness, suitability for children, and price.
The map shows that Motrin is good for children and gentle, while Excedrin is effective and long-lasting. The brands are further bifurcated based on certain parameters, which can be useful to identify a lacking feature in an existing product or tweak the marketing strategy to steer it toward a particular position.
Why use a perceptual map?
Perceptual maps enable you to analyze what and how customers think about your product. As such, it is a crucial tool for marketing and product teams.
Specifically, perceptual maps help product and marketing teams:
- Identify market gaps for new products
- Launch effective marketing campaigns
- Enhance brand identity
- Understand market segment
Identify market gaps for new products
Perceptual maps represent brands laid out against two or more parameters according to customer’s perception. If analyzed carefully, product managers can identify gaps between the customer demands and existing products.
When viewing the perceptual map from the customer’s point of view, it’s useful to focus on the gaps indicating unmet market needs. This can jumpstart your research on how a new product might address those needs.
Launch effective marketing campaigns
Businesses can also analyze the performance of a recent marketing campaign or a recent marketing mix change using perceptual maps. In fact, a perceptual map is a go-to tool for creating a marketing strategy.
Enhance brand identity
A perceptual map helps businesses understand what customers think about their product, which is critical to understanding how to meet their needs by adding new features. This insight helps bolster feature adoption, customer satisfaction, and brand identity.
Understand market segment
Finally, perceptual maps help you better understand the market segments, analyze competitors’ positioning over time, assess the changing needs of customers, and track new products introduced to the target market segment over a period of time.
How do product managers use perceptual maps?
Perceptual maps can help product managers identify potential new features to improve the customer experience or shift the perception toward where the business wants it to be. Product managers can analyze competitor products to understand what specific features might be contributing to their respective positions.
In addition to ideating new features, perceptual maps help product managers identify opportunities to launch entirely new products in an effort to address customers’ unmet needs.
How to build a perceptual map
It is always best to do market research and get an understanding of your product and the competitors in the target market segment. You can conduct a customer survey with questions focused on the parameters that you want to analyze. Based on the answers, you can plot the brands against the selected parameters.
Let’s walk through the process of building a perceptual map step by step:
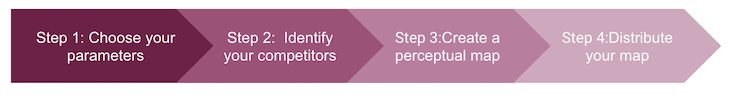
1. Choose your parameters
First of all, you need to choose the parameters that a customer might consider while buying your product. The parameters must be relevant to the target segment and your business objectives.
Consider conducting a market survey focused on the parameters that you want to learn about. A focus group or a thorough secondary market research can also help you to understand the potential parameters for plotting the perceptual map.
Parameters that you can use to plot a map include (but are not limited to):
- Price
- Quality
- Customer service
- Economy
- Convenience
- Design
Another important aspect to consider is the customer pain points. Think about how your product is attracting customers and what might lead them to choose a competitor product. Choosing industry-relevant parameters carefully based on the customer pain points and business objectives is helpful in putting together an accurate perceptual map.
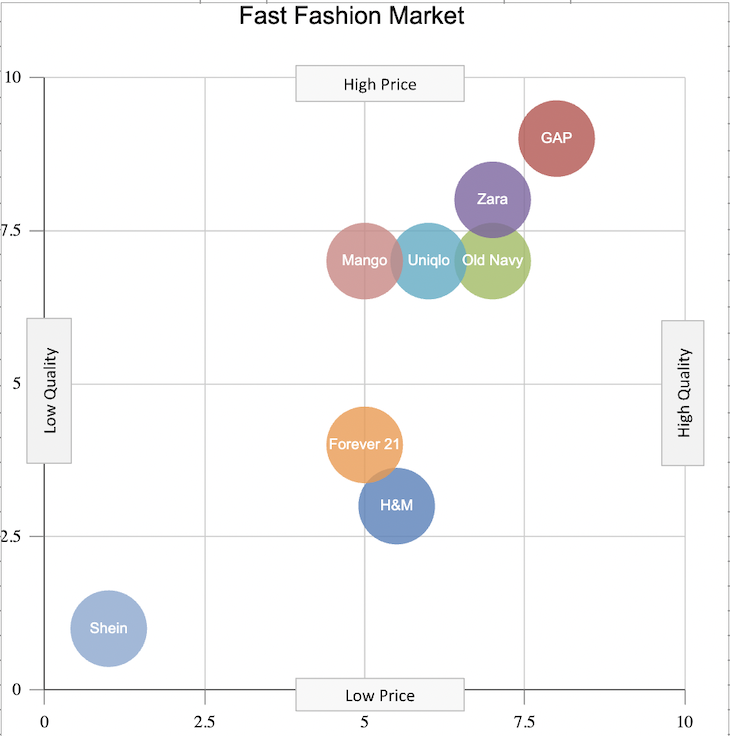
Consider the fast fashion market, for example. There are many parameters to consider when comparing brands, such as quality, trendiness, price etc.
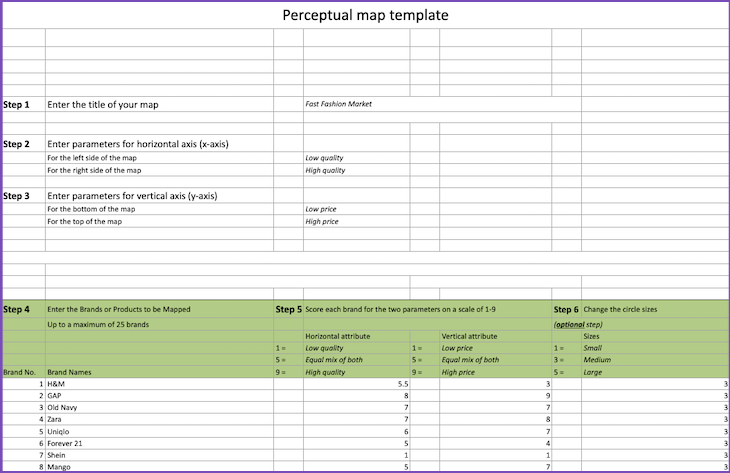
For the plotting of our example perceptual map, I have chosen quality and price as the two parameters. I want to understand how customers perceive different brands in terms of price and quality in the fast fashion category.
2. Identify your competitors
The next step is to identify your competitors. Come up with at least seven to 10 brands to plot on the perceptual map along with your product.
To finalize this list, you can either ask customers to name alternative products during the focus group or brainstorm with your team. Secondary research can also help you identify a list of competitors that you can further verify using focus group studies.
Running a competitive analysis can help you understand your direct and indirect competitors and their strengths and weaknesses compared to yours.
Understanding your target audience in detail and knowing all your product services, target market, and marketing strategies is helpful when conducting a competitive analysis. A competitive analysis can be a time-consuming process, but it is pivotal to identifying your main competitors — which makes the process of creating a perceptual map much easier.
Going back to our fast fashion example, we might consider other major global fast fashion brands, such as H&M, Zara, Uniqlo, Gap, Old Navy, Forever 21, Shein, and Mango.
3. Create a perceptual map
Once you have selected the parameters and a list of competitors, select the two most relevant parameters and start plotting your competitors on a two-dimensional map.
Place all the competitors first on the map, then put your product on the map last. This will force you to analyze the competitive landscape before you add your product onto the map.
If you have conducted a market survey, the next step is to define the score for each brand from 1–9.
Let’s look at mobile phones for an example. We can assume the parameters we want to consider are price (low–high) and quality (low–high). Create a survey focused on how users perceive the brand on a scale of 1–9 and chart out the results in a table. Then, create the perceptual map based on the parameter values for each brand on a two-dimensional scale.
In this case, quality can be x-axis with values from 1–9 and price can be plotted on y-axis with the lowest value at the bottom and the highest at the top:
| # | Brand Names | Quality | Price |
|
1 |
H&M |
5.5 |
3 |
|
2 |
GAP |
8 |
9 |
|
3 |
Old Navy |
7 |
7 |
|
4 |
Zara |
7 |
8 |
|
5 |
Uniqlo |
6 |
7 |
|
6 |
Forever 21 |
5 |
4 |
|
7 |
Shein |
1 |
1 |
|
8 |
Mango |
5 |
7 |
After plotting the brands in the bubble chart, the perceptual map looks like this:
4. Distribute your map
Share your map with stakeholders to get their opinion about the product’s perception among the customers. This is a great way to engage key stakeholders and start a discussion on where the product currently is and where the company needs it to be. Based on this, you might consider altering the marketing strategy to steer the product’s position toward the goal.
The real value of a perceptual map lies in evaluating the position of the brand over a period of time after launching marketing campaigns or changing the marketing strategy. Over time, new products are added to the market and market demand can change. This makes it even more important to analyze the perceptual map over a period of time.
Be sure to update your perceptual map if there are any prominent changes, such as a market shift, the introduction of new products, etc. You should then share the updated perceptual map with the key stakeholders.
Perceptual map template
Click here to access a free perceptual map template that you can use as a starting point to create your own perceptual map. Follow the steps outlined above to generate a perceptual map with your own data collected through focus groups and/or surveys.
The post What is a perceptual map and how to build one (template) appeared first on LogRocket Blog.
from LogRocket Blog https://ift.tt/btnNkXr
Gain $200 in a week
via Read more