As product managers or product marketing professionals, we’re often asked to share the market size of a potential new opportunity. Market size, mostly referred to as TAM, SAM, and SOM, can be confusing. Many of us often wonder what these acronyms mean and how they’re useful.
Quantifying the potential market size backs up a subjective claim of a “large market opportunity” to a definite, penetrable market segment. And as a product professional, one should have a thorough understanding of how to quantify market size — a critical metric to measure the total addressable market.
In this article, we’ll learn about what total addressable market is, why it’s important, how to calculate it, and what it means in product management.
Table of contents
- What is the total addressable market (TAM)?
- The importance of total addressable market
- How to calculate the total addressable market
- How TAM is used in various aspects of product management
- Challenges and tactics for calculating total addressable market
What is the total addressable market (TAM)?
Total addressable market, also referred to as TAM, is commonly used to define the total market demand for a product and service. TAM shows the full market potential in dollars (revenue); however, practically, it is hard to capture 100 percent of the TAM by any company.
A product’s total addressable market is often an important realization — that there is room for scalability. It also defines the wider view and scope of the industry.
Brands mostly consider the market size, which refers to TAM, to show future growth. In other words, TAM helps identify a product or service’s maximum revenue potential across a particular market segment.
The importance of total addressable market
Defining your market is vital if you’re trying to focus on the right customers and competitors or understand where the business can grow in the future. TAM also helps update investors and stakeholders about potential opportunities for the product, which is important for gaining trust in the product’s revenue aspects and scalability.
Moreover, organizations need to understand the impacts on revenue of building a new product and entering a new market segment. TAM is a reflection, and, at times, outlines how attractive the idea is to take a leap of faith. TAM data enables companies to make more informed decisions, particularly if the TAM is too small.
To define your TAM, there are a few key components:
- What are the potential customer segments?
- What industry does that segment belong to?
- What are the big players in that segment and what is the total size of the industry?
- Where can the brand see expected growth in the total market size?
- Who are the new entrants in the segment and where are they located geographically?
It is important to understand the industry, segment, company size, and location to identify the companies that belong to your TAM. This market landscape allows you to identify and prioritize your target market specific to your product, services, or commodities. In addition, breaking down the total TAM by industry, size, and trends ensures that you focus on building your go-to-market strategy to tap the biggest and best opportunity.
How to calculate the total addressable market
There are two common approaches to calculating the TAM — top-down and bottom-up. Let’s dive deep into both methods.
Top-down market sizing
This approach uses the industry-paid data of various market research companies to estimate market size. Secondary data from research institutions like Gartner or data you can pull from Google is helpful here. The idea is to obtain the overall market size that includes your target segments, apply the concept of SAM (service addressable market) and SOM (service operable market), and filter out some criteria to estimate your target market size.
Top-down market sizing is easier, but may not be as accurate as a bottom-up market. In the top-down approach, you can search through tons of data about the overall market size — providing you with a fair idea about if your product and service are scalable or not.
In a nutshell, in a top-down approach, you first understand the macroeconomy, get into a competitive market size for penetration, and finally arrive at market addressability.
Let’s go through an example.
You want to know the overall size of smartwatch customers in India using the top-down method. After doing some secondary research on Google, you know that the watch industry size in India is $6 billion per year. We will benchmark this number to find the final size of the total customers.
Through some additional research, you estimate that approximately 50 percent of people wear smartwatches and around 33 percent prefer mid-segment smartwatches. Now you have important pieces of information in place.
50 percent of $6 billion is $3 billion, which is the best estimation so far. So now you represent a small portion of this larger industry. Further, as your research says, 33 percent of smartwatch wearers prefer mid-price range smartwatches, which is your target segment. This further boils it down to a TAM of $1 billion.
The point to note is that all the assumptions and numbers depend on research data, and you may arrive at numbers by filtering out the criteria that don’t align with your target segments.
Bottom-up market sizing
Bottom-up is exactly what it sounds like — you start from the smaller, known facts, such as average price, number of customers, and very specific market information. Later, based on this, you can build up to get a bigger market size.
Bottom-up market sizing is suitable when you are sure about the price and unit of sales. This method also uses first-party data to estimate revenue.
Consider the same example to find the overall market size of mid-range smartwatch customers in India using the bottom-up method:
The population of India is 1.4 billion people.
Assumption 1: 20 percent of the total population wears a watch. This is 280 million people
Assumption 2: 25 percent of those who wear a watch wear a smartwatch, so the number is now (280 million x 0.25) = 70 million people
Assumption 3: mid-range smartwatches capture two-thirds of the total smartwatches. (2/3 x 70 million) = 47 million people
The unit price of the mid-range watch is, on average, $25
The overall market size = 47 million x $25 = $1.2 billion, approximately
There is a difference of $0.2 billion (or $200 million) between both methods, which is obvious due to assumptions factors. All assumptions should be based on the primary research data.
How TAM is used in various aspects of product management
The various aspects of product management are aligned with TAM sizing. We’ll walk through them below.
Market opportunity assessment
TAM is an important metric for new market entrants and price points. It allows companies to understand how market share may vary based on location, demand, price, and segment. It also pushes the company or product to define its overall competitive landscape.
Product strategy development
TAM is a key part of the user acquisition strategy and, to some extent, marketing campaign strategy. It also helps prioritize the activities based on the market share traffic potential.
Additionally, the product details, functionality, features, and product roadmap play vital roles in building your go-to-market strategy to target the correct market segment more accurately.
Sales and revenue forecasting
TAM is measured based on the current state of the competitive landscape. However, it often varies due to seasonality, demography changes, new tech adoption, and business cycles. Therefore, the calculation should be revisited regularly.
Competitive analysis
There are three important subparts to understand while doing the competitive analysis using TAM. TAM size is bifurcated into two, which are SAM (service available market) and SOM (serviceable obtainable market):
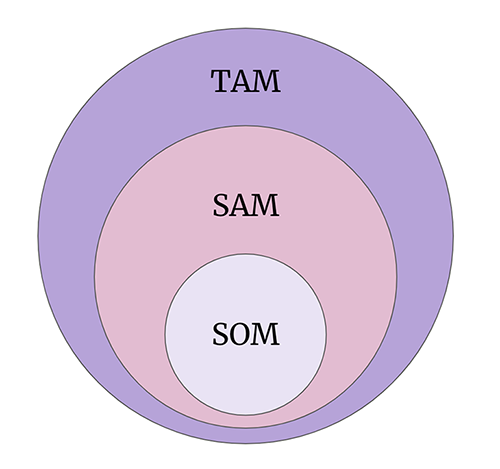
SAM is a portion of the TAM market that can be claimed based on the company’s business model or product. Therefore, it becomes the target market that can be addressed with the current business model. SAM is an important key metric that projects the willingness to pay of the customers (and that a company is willing to serve) with the current product or service.
SOM is the percentage of SAM that the company can realistically capture. To capture this part of the overall market size, the company should have all strategic aspects in place. Their direct market leaders, contenders, high performers, and niche competitors belong to SOM categories.
To start with a competitive analysis, the first thing you need is to clearly understand the market share and your competition’s direct and indirect competition towards you. Another factor while developing your market strategy is identifying the distribution channels and planning to compete with the strength of the competition under SAM and SOM.
Later, it is plotted into a 2×2 competitive analysis quadrant graph drawn for market share and satisfaction.
It is important to be realistic that you will not be the market leader and tap 50 percent of the market share within six months. Therefore, SOM needs to be reasonable; hence it is important to consider a reasonable fraction of the SAM.
Challenges and tactics for calculating total addressable market
There are a couple of things that need to be taken care of for calculating TAM. Out of all the major challenges, market complexity, future uncertainty, and industry disruption are the main ones.
These are the potential reasons why market size estimates often go wrong. First and foremost, overestimating market size often falls to the trap of market saturation. The basis of determining market size is to only focus on the existing markets. Estimating it correctly becomes tricky if customers and technology are new.
Adoption rates can also be hard to estimate due to this new market complexity. TAM is either overestimated or underestimated, thinking on the assumption that the future will look like certain assumptions or trends from the past.
The ignorance of economic realities, such as customers paying more and some less, negates the meaning of a homogeneous market. Therefore, it is important to be aware that industry disruption and particular shifts might take time and are particularly dominated by economic realities.
Conclusion
To conclude, TAM, SAM, and SOM all have different purposes. SAM and SOM exhibited potential and target market, whereas TAM is the potential at scale.
The market size focuses on assessing an investment opportunity for your company and product. Calculating TAM as an exercise offers clarity on the future roadmap, assessing the product market fit, conviction, and accuracy for investors, and putting competitors within the line of sight early on.
Featured image source: IconScout
The post Total addressable market (TAM): Definition and how to calculate appeared first on LogRocket Blog.
from LogRocket Blog https://ift.tt/4HvOzMd
Gain $200 in a week
via Read more