UX benchmarking is the process of evaluating the performance of a company or website based on criteria accepted by stakeholders or universal standards. The process is usually generalized to UX benchmarking research, a type of summative evaluation, that deals with the analysis of relative performance within a company to measure its success.
If you’re here, you’re probably looking for help conducting your own study. I will explain UX benchmarking in detail to understand when a company needs it and break down this complex process, outlining the steps needed for its successful adaptation.
Table of contents
- Benchmarking research
- What does benchmarking mean in a UX context?
- When is benchmarking used in UX?
- UX Benchmarking Study: A Step-by-Step Guide
- Step 0: Necessary UX data to start benchmarking
- Step 1: Identify behavioral and attitudinal issues using a UX audit
- Step 2: Define standards you will look up to
- Step 3: Analyse comparative results and propose solutions
- Step 4: Implement changes
- Step 5: Gather post-change results on the UX metrics of interest
- Step 6: Visualize and report the findings
- Step 7: Record lessons learned
- Step 8: Restart the cycle
Benchmarking research
Benchmarking research focuses on these points:
- Applying specific data you gather from a comparative analysis to the standard
- This data’s usability for your specific website and product
- Its relevance considering the constantly changing environment
- Your target audience
- Your technical abilities to deliver what is needed based on this data
- Your company’s goals
Generally, benchmarking focuses on comparative evaluation to reasonable standards. I’ve used the word “reasonable” on purpose because the company might deal with data that has no universal standards but can identify patterns and trends within the industry to use as a guide for evaluation.
What does benchmarking mean in a UX context?
UX benchmarking research is a complex task that you should address from various perspectives.
In the UX context, we evaluate the company’s or product’s performance based on qualitative and quantitative data. Considering the fact that qualitative data is subjective, we’d need to investigate any behavioral patterns we observe with the company’s end goals in mind. We do this to conclude the success or failure of the company or changes within it.
When is benchmarking used in UX?
Benchmarking is necessary when:
- Return on investment (ROI) is below the stakeholders’ target
- UX metrics are indicating a poor user experience
- Measuring the company’s or UX team’s performance after specific changes in the product
- Market shifts changed the nature of competition
- A new paradigm appeared in industry standards due to innovations, law changes, average industry performance, etc.
In other words, if the company wants to display its strength or understand its weaknesses, opportunities, and threats, it should conduct UX benchmarking.
Benchmarking is always a part of a bigger process for a company’s performance optimization and improvement. Businesses operate in a volatile environment with innovations and new competitors continuously appearing on the market; therefore, a developing company will always have an active team of UX specialists that work full-time to update the company’s design and keep track of customers’ shifting behavioral patterns.
UX benchmarking study: A step-by-step guide
Step 0: Necessary UX data to start benchmarking
The complexity of the UX benchmarking process should not discourage you from conducting it on a regular basis. The larger company is, the harder it is to spot weak spots because more variables are involved in a company’s performance.
However, the first step toward better UX performance relies on extensive background research on the qualitative and quantitative variables involved.
For a successful start, the UX team should identify what they are dealing with by gathering all relevant UX data available for your company. You can break this down into qualitative and quantitative:
- Quantitative:
- Time-on-task — average time of the user’s involvement with the website, completing the particular task
- Conversion rates — the percentage of conversions compared to the total number of website visitors
- Error rate — misled users or technical barriers that led to website interaction failure
- Completion rate — the percentage of completed tasks by users to the total number of attempts
- Engagement — set of actions made by the user on a site (views, clicks, shares, etc.)
- Retention — the percentage of returning users after the first interaction with the company
- Qualitative:
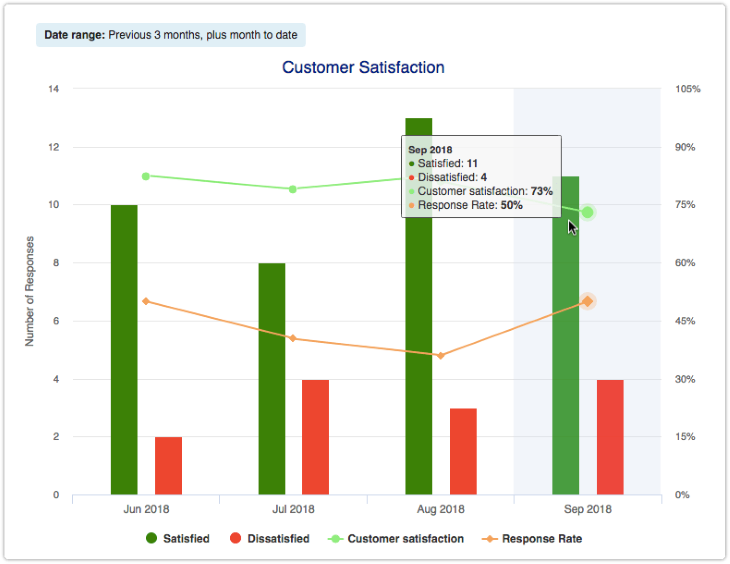
- Customer satisfaction score (CSAT) — a loyalty metric based on the level of user satisfaction
- System usability scale (SUS) — customer’s evaluation of the usability of the website
- Net promotor score (NPS) — users’ readiness to refer others to share the experience they got from the company
- Customer effort score (CES) — measures the amount of effort users had to put in while interacting with the product
- Any other behavioral data that is not measured in numbers but can be used in the UX context
Gathering all the data is generally called a UX audit and is not limited to the variables I’ve mentioned. All of the measurements are a part of understanding the bigger picture: what the audience experiences when they interact with the website. You can further interpret the raw data to spot issues and threats and create opportunities for growth by targeting the weak spots.
How can professionals gather data?
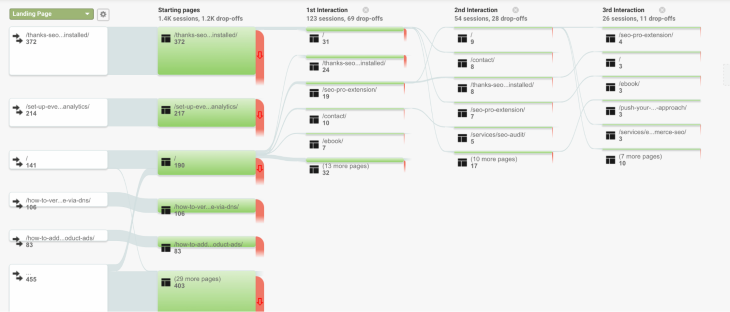
The quantitative data I’ve mentioned is usually measured by professionals using tools like Google Analytics or LogRocket. Such tools provide statistics on everything when it comes to the behavior of the users on the website, as well as a user behavioral roadmap. The roadmap means that tools display the exact movement of the customers on the website.
You should support some data further with statistics on the company’s sales; the total number of clients; the percentage of clients ordering compared to all users coming to the payment page; the number of customers ordering multiple times compared to one-time users, etc.
The only weakness of such data is that it does not show the reason why customers leave specific pages, spend less time on different pages, do not convert, and so on. Answering those questions is the task for UX and UI teams as they analyze the correlation between the numbers they’ve acquired.
The qualitative data mentioned above is always measured by directly contacting the clients using questionnaires or user interviews. While CSAT, SUS, NPS, and CES are usually measured with questionnaire forms, interviews are meant to gather some behavioral data that is deeper and more detailed in explanation. For example, customer feedback forms can clarify if the users like the service or not and give it a score from 1 to 5. Interviews, in such cases, will help you understand exactly why they like the service or not and see at which step of the customer journey users could have an unsatisfactory experience.
Step 1: Identify behavioral and attitudinal issues using a UX audit
Using the data gathered during the UX audit mentioned above, UX professionals should work on finding patterns that explain the customers’ behavior and discovering ways to improve their experience. Possible behavioral and attitudinal patterns that may become a threat to the company’s performance can be summed up as follows:
- Attitudinal:
- Technical problems within the website
- The interpreted quantitative data with deeper analysis if conversions, satisfaction rate, traffic, and retention are below benchmarking standards
- Outdated materials
- Problems with accessibility and usability
- Behavioral:
- Building a roadmap of the customers’ actions might reveal barriers that could impact their choices
- Qualitative data gathered through questionnaires and interviews could provoke concerns and identify weaknesses
Hence, the results of the UX audit may be more specific but usually fall under some of the categories identified. Your UX team should outline all your findings before taking your next steps. Such an outline serves as a basis for the next benchmarking step.
Step 2: Define standards you will look up to
By definition, the benchmarking process relies on a comparison to predefined standards. However, there might not be universal standards that everyone at your company follow, which means that the company has to find reliable standards on its own. There are four types of standards that you can use for UX benchmarking:
- Product performance data — qualitative and quantitative UX metrics that the company had before launching the new product or implementing changes. For example, before the latest changes to the product, the satisfaction rate was 3.5/5, while after the update, the rate increased to 3.75/5
- Competitors’ performance — available industry best practices and their results. For example, your current conversion rate is 1 percent, while your main competitor has 5 percent
- Company’s goals — standards set by stakeholders. For example, your average retention rate is 10 percent, while investors want to achieve 20 percent
- Industry performance — average rates between a set number of competitors. For example, your SUS rate is 2.7/5, while the average rate among the ten main competitors is 4.1/5
Step 3: Analyze comparative results and propose solutions
After identifying the standards, the next step is to compare your current UX metrics and find a solution to improve your performance. Depending on the standard, try asking yourself these questions:
- If you analyzed product performance data:
- Are there technical issues that lead to problems?
- Did the change in product lead to problems?
- Did the product change solve the issue it was meant to tackle?
- What can be done to fix the underperformance/perform even better?
- Competitors’ performance:
- What do they do better, and how?
- How is their input data different (for example, target audience)?
- What can be done to reach their results/increase the gap between your results if your results are better?
- Company’s goals:
- What is our target, and why?
- Is this achievable based on competitors’ performance?
- Will changes lead to higher returns?
- What can be done to satisfy stakeholders?
- Average industry performance:
- Is the data acquired reliable?
- What patterns can be found in the performance of others that led to better results?
- What can be done to enhance your website?
Step 4: Implement changes
Answering why others are performing better or worse than your business is key to understanding what can be done for the company’s development. If standards are lower than your metrics, work on increasing the gap between results and aim for perfection. If others are doing better — analyze why that happened, spot the weaknesses to address, and find opportunities to outperform them.
Your company must always test new things because the market is shifting fast, and staying updated is instrumental to becoming or staying number one in the industry.
Step 5: Gather post-change results on the UX metrics of interest
Positive changes in results are inevitable if the benchmarking is done correctly. Your proposed solutions will benefit the company after implementation, but only if the design team did the cause-effect analysis and user testing correctly.
To confirm whether the actions taken performed well, conduct a post-change UX audit and find fluctuations in results. After the implementation process, the design team checks the primary UX metrics, tracks if they have improved, and compares them with benchmarking standards.
Step 6: Visualize and report the findings
We do benchmarking research to achieve a particular purpose. The data acquired has to be structured and further analyzed; that’s why it’s important to visualize data using charts and infographics to appeal to stakeholders. Such practice is especially relevant if your standards are based on stakeholders’ expectations. The final report must contain the following:
- Achieved vs. previous results vs. set standards
- Evaluation of the underperforming results (if there are any) based on post-implementation data
- Additional adjustments to achieve better results in the future
- References and data proofs that stakeholders can check to confirm the presented data
Step 7: Record lessons learned
Any outcome based on proper benchmarking is a valuable lesson. Analyzing your cases and saving them for future reference is key to successful performance.
If a change did not provide the desired results, the case might prevent similar mistakes in the future. If the project is successful, the company may elaborate on the findings and investigate possible ways to benefit even more.
Benchmarking is not only about measuring success, because negative outcomes can also be used to find opportunities in other areas and prevent future overspending on failing projects.
Step 8: Restart the cycle
There is no limit to perfection. Considering the ever-changing environment and even the fact that a customer profile, as well as user behavior, changes over time, it is always important to target evolving needs. Therefore, the UX design team should always work on new solutions to increase user satisfaction, react to customers’ feedback, and keep track of their behavior to update the company based on shifted data.
The post Conducting a UX benchmarking study step by step appeared first on LogRocket Blog.
from LogRocket Blog https://ift.tt/qisZwMd
Gain $200 in a week
via Read more