In this guide, we’ll define what a cohort analysis is, outline the benefits of conducting both an acquisition and behavior cohort analysis, and walk through a five-step process for running one.
We’ll also explain how the insights gathered in a cohort analysis can help you identify the right steps to reduce churn and improve your retention rate.
Table of contents
- What is a cohort analysis?
- Cohort analysis example
- Types of cohort analysis
- Why conduct a cohort analysis?
- How to reduce churn and increase retention
- How to do a cohort analysis: 5 steps
What is cohort analysis?
A cohort is a group of people banded together by a common trait or circumstance. Cohort analysis is an analytical technique to understand the behavior of a group of people who share common characteristics — for example, users who signed up in November, subscription users who renewed or churned over the past 6 months, etc.
Cohort analysis helps product managers analyze the user experience for particular groups of customers. These insights enable product teams to identify the right steps and features to improve the product experience.
Cohort analysis example
To illustrate what a cohort analysis looks like in practice, we’ll look at an example. Let’s say a TV channel subscription app launched a one-month free trial as a promotion to increase customer acquisition. This promotion was run during the month of October.
Due to this offer, 1,000 users subscribed to the app in October. Sixty percent of the users (600 users) canceled their subscription at the end of the month.
The first step is to analyze the reason why these 600 users opted to cancel their subscription. Let’s look at all the possibilities:
- They didn’t like the content
- They forgot about the subscription
- The monthly subscription rate is too high
You might need to collect some qualitative and quantitative data from various sources to pinpoint the root cause behind the cancellations. For example, you might discover that 80 percent of those 600 users found the subscription rate to be too high, while the rest (20 percent) simply forgot about their subscription.
As a next step, you might consider reducing the monthly subscription price or offering a lower-rate subscription with less content. You might also opt to run retargeting ads at the other 20 percent of users to remind them about the free trial subscription and to check out the content more often.
With the help of qualitative and quantitative data, you can identify the most effective steps for improvement. This is what a basic cohort analysis looks like in practice.
Types of cohort analysis
There are two major types of cohort analysis:
Acquisition cohorts: Identifying the ‘when’
Acquisition cohorts help you understand the pattern of churn — i.e., the moments that cause users to become inactive. Acquisition cohorts distribute the active users per month, per day, or per week, depending on what makes the most sense for your product.
For example, let’s say your users are dropping off each day but you’re also acquiring new users each day. In this case, you should conduct an acquisition cohort analysis by distributing users each day for a specific number of days. You can choose the time period for this analysis to coincide with a specific promotion period or launch of new features.
Below is an example of what an acquisition cohort looks like. The chart shows active users on each day for 10 days and also the number of users retained on each day up to day 10:
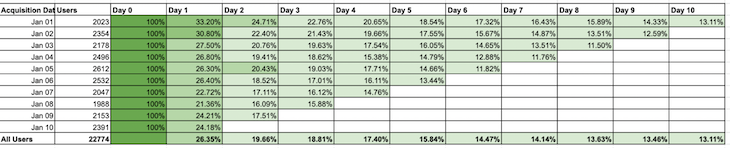
You can see that, on Day 1, only 33.2 percent of active users from Day 0 (signed up on Jan. 1) are retained. By Day 10, this number falls to 13.11 percent. That means roughly 265 users out of 2023 users who signed up on day 0 have been retained while the rest have churned.
If 66.8 percent of users are churning on Day 1, that means they’re not getting what they’re looking for in the application:
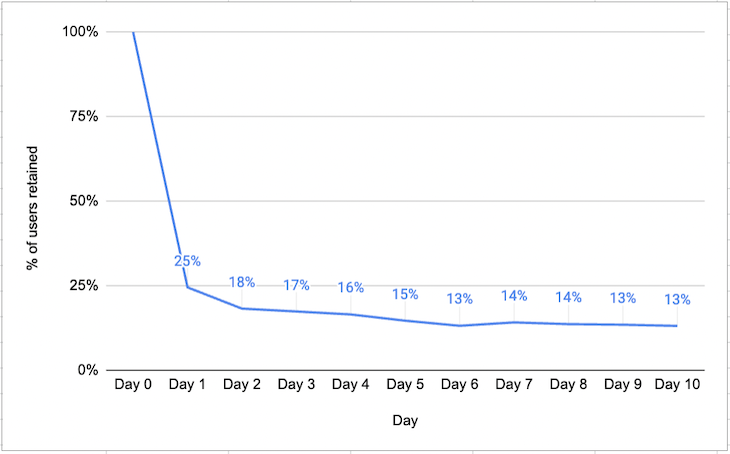
Alternatively, you can turn this map into a retention analysis curve to process the data in an easier way.
This chart shows the retention of active users from cohorts for 10 days. From the graph above, we can deduce that something is happening on Day 1 itself, which is causing 75 percent of the active users to stop using the application.
Over time, only 13 percent of active users are retained by Day 10. Clearly, you can determine the “when” part using acquisition cohorts to conclude when most of the active users are churning.
The next step is to figure out the reason behind the churn for these users.
Behavior cohorts: What behaviors lead to churn?
To figure out the root cause behind users leaving your application, you can do a behavior cohort analysis. This enables you to analyze how long users remain active in the application after they perform certain actions.
For example, let’s say you run a social media application. You can see that some users add friends by sending friend requests and then see their feed populated with their friends’ activities. This action increases the users’ interest and compels them to return to the app to see what’s going on in their friends’ lives.
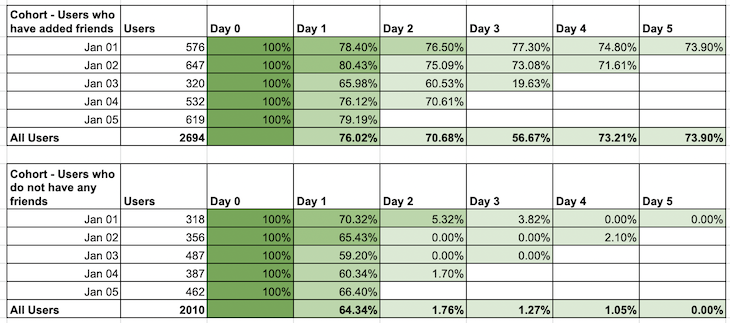
Meanwhile, there is another set of users who never sent out any friend requests and thus don’t have any activity feed to view when they log into the app. For the first cohort of users who have friends, we can see that a good percentage are being retained and coming back to view their activity feed.
Now let’s analyze the second cohort of users who do not add friends after onboarding. These users do visit the app on Day 1 — in fact, the number of users retained on Day 1 is close to that of the first cohort. However, because they are not seeing any activity feed, the users in the second cohort quickly become bored and they rarely come back after Day 1.
This behavior indicates that the users who do not add friends are not seeing any value in the app and hence are not coming back after Day 1:
Next steps based on this data might include attempting to bring users back by providing them with trending posts in their feed or prompting them to add new friends so that they can engage with the app.
Hence, the behavior cohort analysis helps in identifying the reason behind the churn of active users and thus direct the business towards meaningful decisions to retain the users.
Why conduct a cohort analysis?
Running a cohort analysis can help product managers in a variety of ways. We’ll highlight a few benefits below.
A cohort analysis enables product teams to:
- Validate hypotheses
- Improve retention
- Measure customer lifetime value (LTV)
- Understand the conversion funnel
Validate hypotheses
During product development, product managers hypothesize about how the customer will behave in the application. For example, when new features are launched, users are expected to follow certain steps to utilize that feature. A cohort analysis can help you validate that this path is the right one for your users to take.
For a real-world example, let’s say you’re building an e-commerce application. You recently launched a monthly subscription feature that enables users to purchase certain products on a regular basis at a reduced price.
Divide the users into two groups: users who opted for this subscription and users who did not but are still buying the same product frequently and repeatedly. Analyzing the behavior of the two groups can help you understand whether the feature was successful, how many users continued with their subscription, and how soon after did they cancel it.
Although subscriptions lead to saving money for the users, a cohort analysis might reveal that some of the users don’t like to subscribe to get a product every month at a discounted rate because they are not sure if they even need it every month. Increased subscriptions for the same product over a period of time would indicate success of the feature in this case.
Improve retention
To increase revenue, it is crucial to maintain existing users while acquiring new users at a consistent rate. Users might stop using your product for a wide variety of reasons.
You can use a cohort analysis to pinpoint the exact reason why users churn over a period of time and also why a certain set of users are retained over a period of time.
By understanding more about experiences of different user groups or segments, cohort analysis can be used to improve user retention.
Customer lifetime value (LTV)
Customer lifetime value (LTV) is the profit that you make from each customer over time. This metric helps to define how much profit a particular cohort can bring over a certain period.
Different cohorts can indicate different lifetime values. This helps you identify more valuable cohorts and what made them valuable.
By going deeper into lifetime value cohort analysis, you can also pinpoint which marketing campaigns and strategies have been successful.
Understand the conversion funnel
The conversion funnel refers to the steps visitors to your website go through before becoming a user of your application.
You can use a cohort analysis along with the conversion funnel to analyze different cohorts over time and understand the key events that push leads toward conversion.
This is a lengthy process that can span over a few months to collate the data and then analyze user behavior to understand what works and what doesn’t. After the analysis, the marketing strategy can be tweaked accordingly to increase the conversion rate.
How to reduce churn and increase retention
Your product can acquire millions of users, but if they’re not sticking around for long, then even the high acquisition rate won’t matter because the revenue is unsustainable.
That’s why it’s fundamental to retain the existing users while acquiring new users over a period of time. To do this, the need is to identify the pain point for the users that is leading them to stop using the application.
Now to find out the reason behind why users are dropping off from the application, it is crucial to first understand who,what, when and why of user retention i.e.,
- Who is your user?
- What is your retention rate?
- When are users dropping off?
- Why are they leaving your application?
Cohort analysis will help you understand the cohorts or users, your current retention rate, specific events that lead to users leaving the application, and the time period for these triggers.
Acquisition cohort analysis and behavior cohort analysis can provide data on the who, what, when, and why for retention. The results of the analysis help you make informed product decisions to minimize the events leading to churn and hence increase user retention.
How to do a cohort analysis: 5 steps
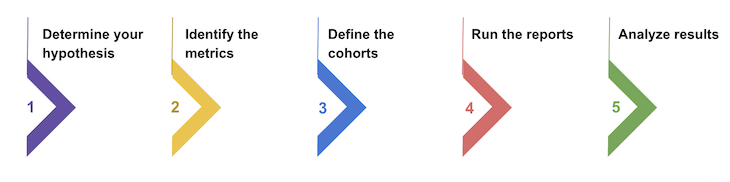
The purpose of a cohort analysis is to test a hypothesis on a group of users based on common characteristics and analyze their behavior to improve business goals. Any cohort analysis involves five basic steps:
- Determine your hypothesis
- Identify metrics to track
- Define the cohorts
- Run the report
- Analyze the results
1. Determine your hypothesis
The very first thing to do is to finalize a hypothesis to test. It could be about increasing user engagement, increasing conversion rate, or increasing retention/reducing churn.
For example, say a new feature has been launched and the business needs to know how successful it has been so far. You might hypothesize that user engagement increased after launching the new feature.
You can divide the cohort into the same group of users before and after the launch. Analyzing the two cohorts over a period of time to see if they have been spending more time in the product after the launch of the new feature can indicate increased user engagement.
2. Identify metrics to track
Depending on the hypothesis to be tested, identify the metrics most relevant to analyze the cohort data.
For example, for hypotheses on user engagement, use metrics such as the average session duration, session frequency, acquisition rate, etc. Similarly, for a hypothesis on retention, metrics such as DAUs, MAUs, stickiness ratio, retention rate over 30 days etc. are good to measure.
3. Define the cohorts
Cohorts are groups of users with a common characteristic, such as the same sign up date, age group, gender, location, etc. Depending on the hypothesis to be tested, the cohorts need to be chosen carefully.
For example, a let’s say SaaS business ran a discounted subscription price for services during a sale season. In this case, cohorts might include the users who subscribed during the sale season and those who subscribed before the sale season at the regular price point.
The cohort analysis can help you calculate the retention rate in both groups over a period of time and analyze whether the discounted subscription was successful in retaining more users.
4. Run the report
Once the cohorts have been defined, the next step is to run the report, either manually in a spreadsheet or using software with cohort analysis features. Such tools enable you to view the results within seconds and thus save the time you would otherwise spend manually adding the data to a spreadsheet.
5. Analyze the results
The final step is to analyze the report and carefully deduce answers to the hypothesis set during the first step. Over time, analysis of the data presented in the report will either support the hypothesis or prove it to be wrong.
Conclusion
Combining various cohort analyses can unleash valuable information about the behavior of your active users. These insights are invaluable when making decisions about go-to-market and product strategy.
Featured image source: IconScout
The post Cohort analysis: How to reduce churn and improve retention appeared first on LogRocket Blog.
from LogRocket Blog https://ift.tt/08NjqkP
Gain $200 in a week
via Read more