As children, we usually develop a phobia of math because of the complex calculations and hard equations we’re taught in school. But if you organize data in a chart, graph, or any other visual representation, then it seems beautiful.
Needless to say, parsing data using charts is much easier. Users find information easy to remember when it includes some visuals.
If you’re thinking of developing a chart library by yourself, imagine the time it takes to develop and then maintain the library. Thus, properly well-written and maintained libraries are life-savers.
We have several charting libraries at our disposal that provide methods for visualizing data, allowing you to develop your own components and maintain data. The question is, which charting library do you need to pick? Let’s see which charting libraries are available for Vue.
The top libraries for Vue.js
Plenty of good Vue charting libraries are out there, but choosing one from all the options is a bit daunting.
I’ve compiled a list of some of the best libraries supported in the Vue ecosystem by criteria like features, documentation, and maintenance. Without further ado, in no particular order:
Chart.js
Chart.js is one of the simplest, most extendable, and most powerful Vue charting libraries out there with 4.6K+ stars on GitHub. vue-chartjs is based on Chart.js, which means you need to install Chart.js as a dependency package.
If you’re familiar with Chart.js, then this will seem easy to you. It simply exposes the Chart.js object and creates a wrapper that allows writing custom logic on it, thus getting you max flexibility.
Additionally, vue-chartjs is based on Vue’s component principle, which helps you create reusable components. It has well-explained documentation that is very easy to understand.
vue-chartjs has been available since 2016 and is based on solid community support. To start, use npm, the Yarn package manager, or CDN links.
The library provides beautiful charts with static or dynamic data. On top of this, you can also change components’ props. Some available chart types are bar, line, pie, radar, polar area, bubble, and scatter. vue-chartjs provides flexibility, meaning you can create your own custom chart type or modify the existing one. One more benefit is it is compatible with TypeScript and the mixin module is installed by default.
ApexCharts: A simple and flexible library
With sixteen types of charts, vue-apexcharts stands out among all other chart libraries. ApexCharts is a feature-loaded charting library that eases the task of data visualization by providing 100+ samples.
If your system considers responsive screen size, then you can’t ignore ApexCharts; it provides responsive and interactive design. And when it comes to visualization, performance cannot be ignored. Thus, the performance of ApexCharts is up to the mark.
ApexCharts has a whopping 16.3K stars on GitHub (the Vue repo has 1K+ stars) with almost a hundred contributors. It has no dependency on other charting libraries. A beginner can also learn quickly by referring to its documentation.
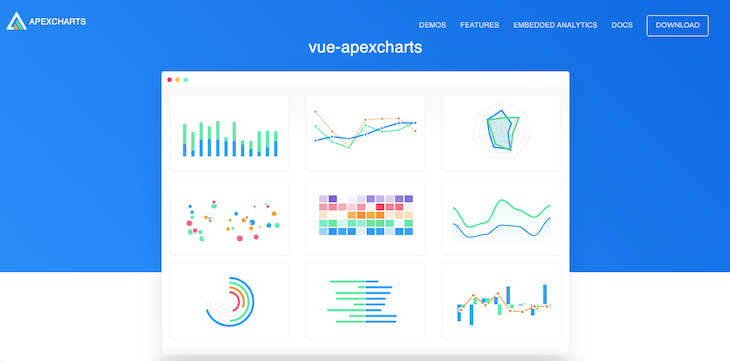
ApexCharts provides smooth animation, which is pretty good for user attention. Also, you have many existing theme pallets that can be used on the fly. Vue-ApexCharts has an MIT license and it’s free to use, modify, and distribute with default conditions.
Apache ECharts: A library with twenty chart options
When you have hands-on experience with Apache ECharts and want to integrate it in Vue, then vue-echarts is there for you. It was built with Apache ECharts and supported with Vue versions 2 and 3. It has over twenty chart options that are fully customizable. vue-echarts has inbuilt components like calendars, data zoom, SVG rendering, visual mapping, etc., which can be useful to create a beautiful web page.
It has currently 6.8K+ starts on GitHub with wide community support. The library supports almost all methods and events that are available in Apache ECharts. Additionally, it has a good option to reduce bundle size. You just need to directly import EChart module like so:
import 'echarts/lib/chart/bar'
import 'echarts/lib/component/tooltip'
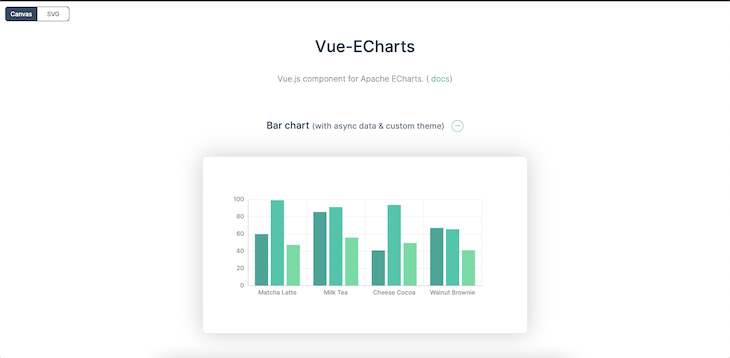
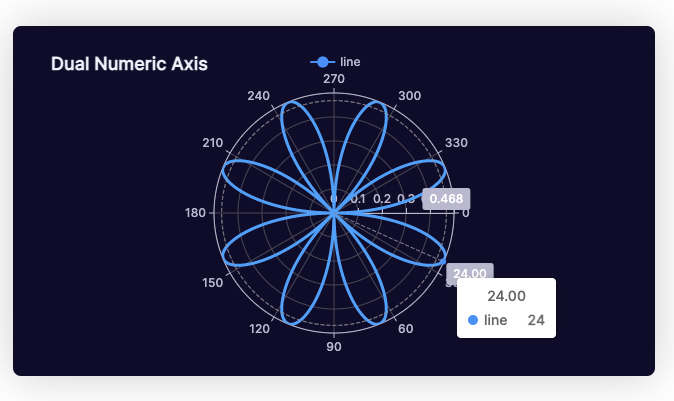
There’s no proper documentation available; you need to refer to everything on GitHub itself.
Use as a CDN or install as a package via yarn or npm to get started with vue-echarts.
D3: Build the chart you want
D3 is a very famous and vast JavaScript library for dynamic and interactive data visualization. It obeys all the rules of web standards. D3 has 200M downloads and 101K stars on GitHub, and there are an infinite number of charts that can be created with D3.
D3 supports SVG with an external stylesheet, customized animations, and responsive charts. A good part of using D3 is that it just relies on HTML, SVG, and CSS; there’s no more tech or tools required to work on D3. It works fast with even a large number of data points.
Per the documentation, “D3 helps you bring data to life using SVG, Canvas and HTML. D3 combines powerful visualization and interaction techniques with a data-driven approach to DOM manipulation, giving you the full capabilities of modern browsers and the freedom to design the right visual interface for your data.”
D3 provides a way to use single modules separately and combine them into a d3 object using Object.assign, which reduces the project build size. The thing that needs to be taken care of is letting Vue play with DOM manipulation; don’t do it with D3.
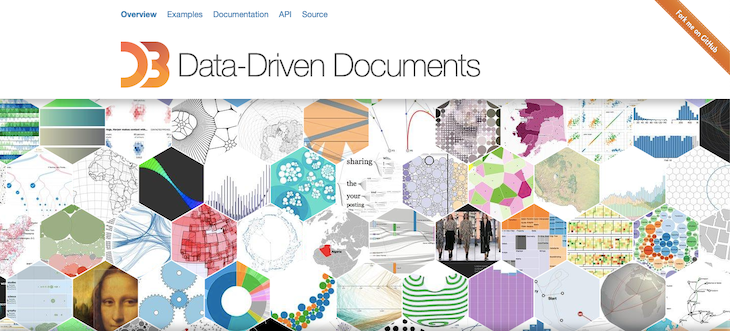
There is wide community support for D3 that helps you to solve your impediments. If you want to create an animation, custom chart, or create a new chart type, then there’s a chance that somebody can help you out. You can use it as an npm package in your Vue project.
Three.js: Good for 3D data visualization
Three.js is the best 3D, open source library out there, with a tremendous 80k stars on GitHub and almost 1.6K contributors. If you want to work with 3D rendering and you’re looking for a lightweight and cross-browser supportive library, then Three.js is one of the best options to go with.
Life is easy because we don’t need to use the Canvas API for each 3D rendering. WebGL (a JavaScript API) is the support system here, and Three.js is using it for generating 3D visuals; it doesn’t require any third-party plugin.
Three.js provides many possible options to create 3D visualizations like animations, materials, scaling, lights, effects, cameras, and many more. 3D graphics need math, and Three.js abstracts all math operations and provides an interface where you can use them. It has its own math library that is used for 3D math.
Adding extra dimension always helps, and for creating 3D charts, there are many beautiful rendering options available in Three.js. Here, you can design and architect your chart from scratch using available methods.
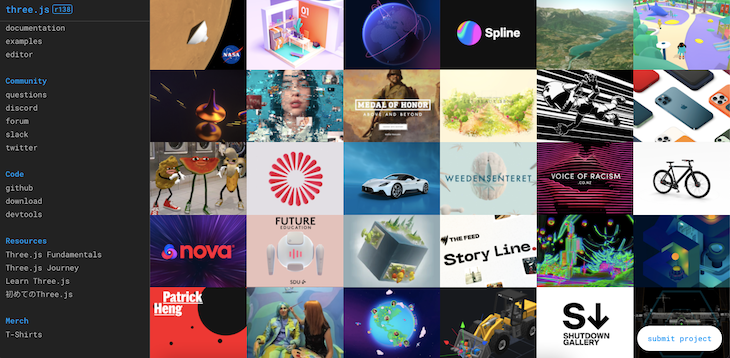
Three.js is available as an npm package, so it’s easy to implement for a Vue project. If you want CDN, that’s also available.
trading-vue-js: A solution for financial charts
There’s a special requirement when you just want trading-oriented charts for your application. To serve that purpose, the trading-vue-js charting library comes into the picture.
This library provides charts to visualize trading datasets, like the candlestick chart. It is easy to put your custom indicators on a candlestick chart.
trading-vue-js is open source; you can customize it how you want, such as changing color, adding extra props, or improving chart performance. As per the documentation, it is quite fast…until there are three million data points.
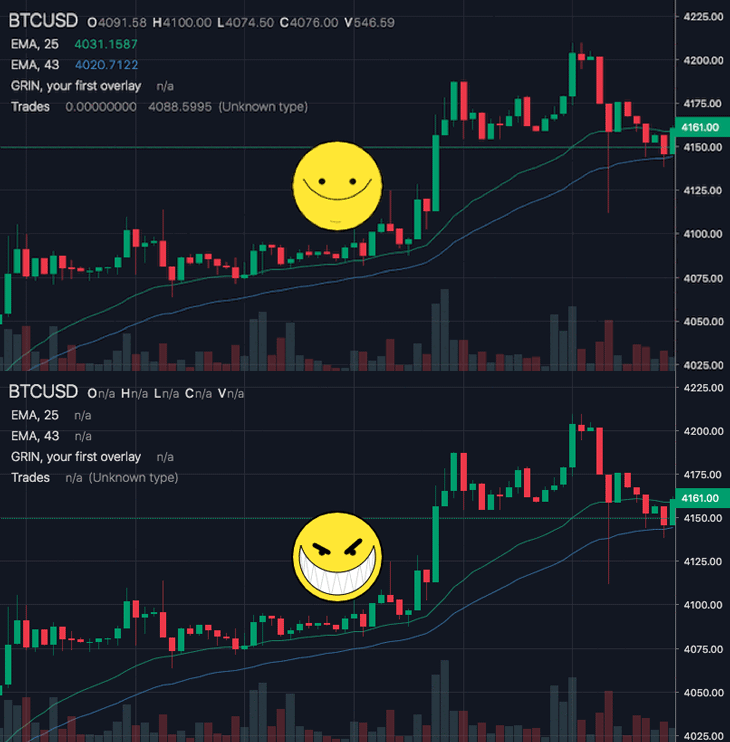
Most importantly, a trading page needs to be supportive for all screen sizes, and trading-vue-js provides a responsive option. Another key benefit is that it provides zooming options for better visualizations.
Plotly: Built on top of D3 and stackgl
Plotly is a standalone data visualization library built on top of D3.js and stackgl. It has over 14.5K stars on GitHub and good documentation, which makes development easy. Plotly eases the process of chart generation by providing over forty chart options.
As per the official documentation, “Plotly.js can be used to produce dozens of chart types and visualizations, including statistical charts, 3D graphs, scientific charts, SVG and tile maps, financial charts, and more.”
Plotly supports responsive/fluids layouts and many configuration options. Generally, it supports all basic, statistics, scientific, financial, and 3D charts. If you want to play with animations, then you can also create beautiful animations with the help of Plotly.

If you want any help regarding Plotly, there’s a contact form that leads your query directly to the library maintainer. There’s also the vue-plotly npm package built to use directly, but one major drawback of using it is that the package has not been updated in the last two years. If you want to omit that package option, then you can use the Plotly npm package or load link in the script tag.
Billboard: Another D3 library with ES6+ syntax
Like many other chart libraries, Billboard is based on D3. That means you need to load D3 when you’re importing Billboard.js in a script. Because of good documentation, the learning curve is pretty simple; you can create a chart with minimal effort. Additionally, it supports ES6+ syntax, which is good for modern JS frameworks. It has more than 5.1K stars on GitHub.
Billboard provides multiple options that can be combined in a single chart to make the chart more useful. Apart from that, the library size of Billboard is around 169Kb, which is very low compared to other charting libraries.
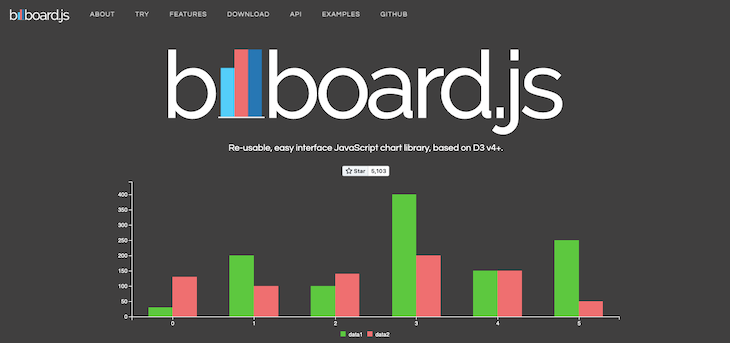
With a variety of examples provided by Billboard, it’s easy to get started. It provides both options: you can use it as a CDN link or as an npm package.
Conclusion
Data plays a vital role in design, and as such, it is a must-have in any app. Numerous libraries are available across the web to serve the same purpose.
Here, I picked the best and most widely used ones. These libraries provide benefits to Vue devs in terms of data integration, maintenance, and designing beautiful pages. Apart from that, most are easy to integrate.
You can use an existing library to get rid of extra writing and clean up a messy codebase. Remember that before integrating the library in your system, read through all provided features and use cases. At least check the end result before finalizing. In the end, choose whichever suits your project the best with the requirements that you have on your plate along with the features that you want in your system.
The post The 8 best chart libraries for Vue appeared first on LogRocket Blog.
from LogRocket Blog https://ift.tt/y861ZnP
via Read more


